Sunday, December 29, 2013

A Year-End "Review"

This is the time of year when many people both look back at the year just past—and ahead to the next with a fresh perspective. It’s also that time of year when many make lists.

So, whether you’re looking to make some New Year’s resolutions, or just looking to improve your overall financial situation, here are 10 things to check off your 2013 list—and that can get your 2014 list off to a strong start.
  1. Deal with debt (see Savings Resolutions for the New Year).
  2. Establish a savings goal for retirement (see Estimate “Ed”).
  3. Save for retirement—at work, or on your own (see Saving for Retirement Outside of Work).
  4. Save early so that your savings can work for you (see The “Magic” of Compounding).
  5. If you do have a retirement plan at work, make the most of it (see Making the Most of your Retirement Plan).
  6. Maximize your savings—see if you’re eligible for the Savers’ Credit (see Credit Where Credit is Due).
  7. See if a Roth 401(k) makes sense for your situation (see To Roth or Not?).
  8. Know how much you’re paying for your retirement savings (see Shedding Some Light on your Workplace Retirement Plan Fees).
  9. Keep an eye on your retirement savings investments (see Are Your Savings Investments Over-weighted?).
  10. Don’t forget that you may have other important savings goals as well (see College “Education”–Saving For College).
Of course, a good place to start—any time—is to Choose to Save.® You can find a wide variety of tools and resources—including the popular and widely recommended BallparkE$timate—at www.choosetosave.org[1]


Nevin E. Adams, JD

If you are interested in, or working on, issues of financial literacy or savings education, you’ll want to check out $avings Account$, a free monthly update from the American Savings Education Council (ASEC) on the latest research and updates on new (and old but relevant) tools, as well as keep you up-to-date on various events, conferences, and symposiums relevant to ASEC’s Mission: To make saving and retirement planning a priority for all Americans.  You can sign up online here.

[1] Organizations interested in building/reinforcing a workplace savings campaign can also find a variety of free resources there, courtesy of ASEC.  Choose to Save® is sponsored by the nonprofit, nonpartisan Employee Benefit Research Institute Education and Research Fund (EBRI-ERF) and one of its programs, the American Savings Education Council (ASEC). The website and materials development have been underwritten through generous grants and additional support from EBRI Members and ASEC Partner institutions.

Sunday, December 22, 2013

Believe Able

In that holiday classic “Miracle on 34th Street,” a man named Kris Kringle (who claims to be “the one and only” Santa Claus) winds up having his sanity challenged in court. Ultimately, the judge dismisses charges that would have resulted in Kringle’s institutionalization—not because he actually is persuaded to believe by the evidence that Kris is the REAL Santa Claus, but because he finds it convenient to demur to the determinations of a higher authority (in this case, the US Postal Service).

While belief may not always be a portent of reality, it can be a powerful force, as any parent who has ever nurtured Santa’s existence well knows.

The 2013 EBRI/Greenwald & Associates Health and Voluntary Workplace Benefits Survey¹ (WBS) reveals that most workers believe their employers or unions will continue to provide health care insurance— although there have been employer surveys indicating that, at some point in the future, some may not. Not that workers fail to appreciate future uncertainties: While 46 percent of worker respondents to the WBS indicate they are extremely or very confident about their ability to get the treatments they need today, only 28 percent are confident about their ability to get needed treatments during the next 10 years.

Similarly, when it comes to retirement, the Retirement Confidence Survey² has, for nearly a quarter century now, shown a remarkable resilience in worker confidence regarding their financial future in retirement, belying the aggregate savings levels indicated in that same survey. Over the course of that survey, we’ve seen confidence wax stronger and then wane―and while we’ve seen distressingly low levels of preparation, more recently we’ve also seen a growing awareness of the need for those preparations. The RCS has also documented a consistent trend in workers believing they will be able to work, and to work for pay, longer than the experience of retiree respondents suggests will be a viable option.

Next month we’ll field the 24th annual version of that Retirement Confidence Survey, where we will (among other things) seek to gain a sense of American workers’ preparation for (and confidence about) retirement, as well as some idea as to how those already retired view the adequacy of their own preparations. Is a lack of worker confidence about retirement finances a troubling indicator? Or does it suggest that they have a greater appreciation for the need to prepare?

Later in the year the WBS will, as it has since 1998, probe sentiments about health care and voluntary benefits: Will workers sense a continued commitment by their employers and unions to provide health care coverage? If not, how might that affect their commitment to their work and their workplace? How might concerns about health coverage affect and influence retirement preparations?

In the cinematic “Miracle,” there seems to be a connection between believing something will happen and its reality. Little Susan Walker goes so far as to intone “I believe… I believe… It’s silly, but I believe!” even as she stumbles upon the home of her dreams.

In the real world, the linkage between belief and reality isn’t generally so convenient. And employers, providers, and policy makers alike, know that being able to anticipate those potential gaps between belief and a future reality can be critical.

- Nevin E. Adams, JD

In addition to providing financial support to two of the industry’s most highly regarded employee benefit surveys, underwriters of the RCS and WBS have access to special early briefings on the findings, in addition to a number of other benefits. If you’d like to know more, email Nevin Adams at nadams@ebri.org

You can find additional information about the RCS online here and information about the WBS (previously called the Health Confidence Survey) online here.

¹ See “2013 Health and Voluntary Workplace Benefits Survey: Nearly 90% of Workers Satisfied With Their Own Health Plan, But 55% Give Low Ratings to Health Care System,” online here.

² See “The 2013 Retirement Confidence Survey: Perceived Savings Needs Outpace Reality for Many,” online here.

Sunday, December 15, 2013

"Keep" Sakes

Ask any benefits manager why their organization offers benefits to their workers, and my experience suggests that the reliably consistent answer is “to attract and retain the best workers.”

Indeed, as the 2013 Health and Voluntary Workplace Benefits Survey (WBS)¹ bears out, the benefits package that an employer offers prospective employees is an important factor in their decision to accept or reject a job. In fact, a full third of employees say the benefits package is extremely important, and another 45 percent say it is very important. Moreover, a quarter of employees report they have accepted, quit, or changed jobs because of the benefits—other than salary or wage level—that an employer offered or failed to offer.²

However, the WBS also found that many workers are not especially satisfied with the benefits package offered by their employer: 31 percent are only somewhat satisfied, and one-quarter are not too satisfied (12 percent) or not at all satisfied (14 percent).

It is, of course, entirely possible that these workers are genuinely dissatisfied with the options provided by their employer. On the other hand, the WBS found that a substantial minority of employees may be confused about the benefits their employer offers and who pays for them—a level of ignorance that belies the time and expense often undertaken by employers in making those offerings available.

Employers increasingly look not only to attracting and retaining a qualified workforce, but (at an appropriate time and place), to helping an aging workforce migrate into retirement—a process that can be assisted by a well-crafted benefit program. And it’s not surprising that workers see value in offering additional voluntary benefits to those nearing retirement age.

In fact, the WBS finds that large majorities of workers say they think the following products and services would be extremely or very valuable to workers nearing retirement age:
  • An annuity product that makes guaranteed monthly lifetime payments (83 percent).
  • Life insurance that pays benefits to the surviving spouse, helping to replace income from Social Security or other sources that is discontinued when a worker dies (77 percent).
  • Retirement planning that includes assistance with deciding when to retire, when to claim Social Security benefits, what Medicare option to choose, and how to set up a stream of income for retirement (76 percent).
  • Long-term care insurance (71 percent).
During my working life, there have been times when I didn’t care much about certain aspects of the benefits package. As a young, single individual, I focused primarily on salary and vacation—cared less about health care insurance than I should have, while retirement benefits, even for someone who worked with them every day, were distant prospects. As my family grew, my priorities (and those that I assigned to various benefits) shifted. It was still presented as a package, of course, but the various components mattered more or less depending on my personal situation.

Ultimately, employers looking to keep the best workers committed and engaged know that benefits, like workers, have a life cycle, and that programs designed to keep the best workers are not only well-designed for those various life stages, but (as the WBS reinforces) are well-communicated and reinforced throughout a worker’s career.

Nevin E. Adams, JD

¹ The 2013 Health and Voluntary Workplace Benefits Survey (WBS) was conducted by EBRI and Greenwald & Associates. Additional information can be found online here.  If you’d like to become an underwriter of this important survey, please contact Nevin Adams at nadams@ebri.org, or Paul Fronstin at fronstin@ebri.org

² “Views on the Value of Voluntary Workplace Benefits: Findings from the 2013 Health and Voluntary Workplace Benefits Survey,”, can be found in the November 2013 EBRI Notes article online here.

Sunday, December 08, 2013

"Half" Measures

People are often grouped into one of two camps: the optimists, who generally see the glass as half-full, and the pessimists, and who are said to view the glass as half-empty.

One of the most commonly cited data points about retirement is that “only about half of working Americans are covered by a workplace retirement plan.” Drawn from the U.S. Census Bureau’s Current Population Survey (CPS), it’s cited by both those who see the current system as inadequate (or worse), as well as its most ardent champions—in other words, both by those who see the glass as half-full, and those who are inclined to see it as half-empty.

This is a data point that we’ve written about before, and one that was acknowledged in a recent EBRI Issue Brief[1] that explored various demographic and economic factors that affect retirement plan participation. The data point is relatively simple math: the number of workers who say they participated in a workplace retirement plan divided by the total number of workers. But when you take a closer look at the numbers, it’s not really that straightforward—especially since there are various types of workers, and that makes a huge difference in retirement coverage.

Consider that, according to that CPS data, in 2012, a total of 80.5 million workers worked for an employer/union that did not sponsor a retirement plan. However, the EBRI analysis reveals that of the wage and salary workers in this group:
  • 8.9 million were self-employed—and thus ostensibly could have started a plan on their own without the action of an employer.
  • 6.4 million were under age 21—below ERISA’s minimum-age coverage limit.
  • 4.3 million were age 65 or older—beyond what many (and most retirement plans) still consider ”normal” retirement age.
  • 32.6 million were not full-time, full-year workers—also not required to be covered by a workplace retirement plan under ERISA.
  • 17.0 million had annual earnings of less than $10,000.
Now, many of these workers fell into several of these categories simultaneously, such as being under age 21, having less than $10,000 in annual earnings, and not being full-time, full-year workers. So, as the EBRI analysis explains, once you apply certain commonsense filters for age, annual earnings, work status, and/or employer size, you can get a more realistic perspective.

If you consider the population of wage and salary workers ages 21–64 who work full-year, make $5,000 or more in annual earnings, and work for employers with 10 or more employees, 32.5 million—or 36.4 percent of this population—worked for an employer that did not sponsor a retirement plan in 2012.

Said another way, nearly two-thirds of workers with those characteristics worked for an employer that DID sponsor a retirement plan in 2012. Either way, the population of workers who don’t have access to a workplace retirement plan who might reasonably be expected to participate is considerably different than the simplistic assessment offered by the commonly cited “less than half” data point.

Different people can look at the same data and draw different conclusions: some are inclined to see the glass as “half full,” others look at the same results and say it’s “half empty.”

But none of that matters if you’re looking at the wrong size glass.

Nevin E. Adams, JD

[1] The November EBRI Issue Brief, “Employment-Based Retirement Plan Participation: Geographic Differences and Trends, 2012” is available online here.

Sunday, December 01, 2013

Hind "Sleights?"

In recent days, we have commemorated both the 50th anniversary of the assassination of President Kennedy, and the 150th anniversary of the Gettysburg Address. Occasions such as these are natural opportunities for us to look back and reflect on the past—to consider what has happened since—and to consider what might have been.

As imperfect as our perception of current events can be, so-called 20/20 hindsight isn’t always what it’s cracked up to be, either. Even for those who were “there,” memories can be shaped or influenced by the passage of time, the perspectives of others, media coverage, and the like.

In the world of employee benefits, if you’ve ever said (or intimated) that traditional pension plans in the private sector were once widespread,¹ that health care insurance exchanges are a new concept,² or that 401(k)s were a legislative “accident” discovered (and promoted) by a single “father”—well then, you’re likely contributing to the confusion about the realities of the past that can obscure an appreciation of the present, and a clearer vision for the future.

Next month we’ll be commemorating EBRI’s 35th anniversary,³ and on Dec. 12 we’ll also be conducting our 73rd policy forum. A series of expert panels will be considering the state of employee benefits—as it was, as it is, and as it is likely to be. We’ll have the perspectives of those who have been directly involved in the development and execution of policies at the dawn of ERISA, who have both negotiated and navigated the subsequent regulatory, operational, and legislative shifts, and futurists who are helping anticipate (and perhaps shape) the next generation of employee benefit plan designs.

Hindsight—insights—foresight. It’s a unique combination. You’ll want to be “there.”

Join us.

The agenda for EBRI’s 73rd policy forum (and registration details) are online here. You can view the recorded webcast HERE

Nevin E. Adams, JD

¹ See “The Good Old Days,” online here.

² See “Private Health Insurance Exchanges and Defined Contribution Health Plans: Is It Déjà Vu All Over Again?” online here.

³ For additional insights, see the Fall 2013 EBRI President’s Report from Dallas Salisbury, online here.

Sunday, November 24, 2013

Take It or Leave It?

While each situation is different, in my experience leaving a job brings with it nearly as much paperwork as joining a new employer. Granted, you’re not asked to wade through a kit of enrollment materials, and the number of options are generally fewer, but you do have to make certain benefits-related decisions, including the determination of what to do with your retirement plan distribution(s).

Unfortunately, even in the most amicable of partings, workers have traditionally lacked the particulars to facilitate a rollover to either an individual retirement account (IRA) or a subsequent employer’s retirement plan—and thus, the easiest thing to do was simply to request that distribution be paid to him or her in cash.

Over the years, a number of changes have been made to discourage the “leakage” of retirement savings at job change: Legal thresholds for mandatory distributions have been set; a requirement established that distributions between $1,000 and $5,000 on which instructions are not received either be rolled over into an IRA or left in the plan; and even the requirement that a 20 percent tax withholding would be applied to an eligible rollover distribution—unless the recipient elected to have the distribution paid in a direct rollover to an eligible retirement plan, including an IRA. All these have doubtless served to at least give pause to that individual distribution “calculus” at job change.

Indeed, a recent EBRI analysis¹ indicates that workers now taking a retirement plan distribution are doing a better job at holding on to those retirement savings than had those in the past. Among those who reported in 2012 ever having received a distribution, 48.1 percent reported rolling over at least some of their most recent distribution into another tax-qualified savings vehicle, and among those who received their most recent distribution through 2012, the percentage who used any portion of it for consumption was also lower, at 15.7 percent (compared with 25.2 percent of those whose most recent distribution was received through 2003, and 38.3 percent through 1993).

As you might expect with the struggling economy, there was an uptick in the percentage of recipients through 2012 who used their lump sum for debts, business, and home expenses, and a decrease in the percentage saving in nontax-qualified vehicles relative to distributions through 2006. However, the EBRI analysis found that the percentage of lump-sum recipients who used the entire amount of their most recent distribution for tax-qualified savings has increased sharply since 1993: Well over 4 in 10 (45.2 percent) of those who received their most recent distribution through 2012 did so, compared with 19.3 percent of those who received their most recent distribution through 1993.

The EBRI report also notes that an important factor in the change in the relative percentages between the 1993 and 2012 data is the percentage of lump sums that were used for a single purpose. Consider that among those who received their most recent distribution through 2012, nearly all (94.0 percent) of those who rolled over at least some² of their most recent distribution did so for the entire amount.

There is both encouraging and disappointing news in the EBRI report findings: The data show that improvement has been made in the percentage of employment-based retirement plan participants rolling over all of their LSDs on job change, along with less frequent pure-consumption use of any of the distributions. However, the data also show that approximately 55 percent of those who took a lump-sum payment did not roll all of it into tax-qualified savings.

In common parlance, “Take it or leave it” is an ultimatum—an “either/or” proposition that frequently comes at the end, not the beginning, of a decision process. However, as the EBRI analysis indicates, for retirement plan participants it is a decision that can (certainly for younger workers, or those with significant balances) have a dramatic impact on their financial futures.
Nevin E. Adams, JD
 
¹ The November 2013 EBRI Notes article, “Lump-Sum Distributions at Job Change, Distributions Through 2012,” is online here. 
 
² Two important factors in whether a lump-sum distribution is used exclusively for tax-qualified savings appear to be the age of the recipient and the size of the distribution. The likelihood of the distribution being rolled over entirely to tax-qualified savings increased with the age of the recipient at the time of receipt until age 64. Similarly, the larger the distribution, the more likely it was kept entirely in tax-qualified savings.

Sunday, November 17, 2013

Use It or “Lose” It

At the time that EBRI was founded 35 years ago, I was about six months into a job doing pension accountings for a large Midwestern bank. At the time, I didn’t realize I’d still be working with those kinds of issues in 2013—in fairness, like most recent college graduates, I wasn’t really thinking about anything that was 35 years in the future. I had a job, a car that ran, and a reasonably nice stereo in an apartment in the Chicago suburbs that didn’t have much else.

My employer had a nice defined benefit (DB) pension, and an extraordinarily generous thrift-savings plan, but those weren’t big considerations at the time. I had to wait a year to participate in the latter (pretty much standard at the time), and as for the former—well, you know how exciting pension accruals are to 22-year-olds (even those who get paid to do pension accountings). Turns out, I worked there for nearly a decade, and walked away with a pretty nice nest egg in that thrift savings plan (that by then had become a 401(k)), and a pension accrual of…$0.00.

At the time, I didn’t think much about that.  Like many private-sector workers, I hadn’t contributed anything to that pension, and thus getting “nothing” in return didn’t feel like a loss.

By the time I left my second employer (this time after 13 years), the mandated vesting schedules had been shortened by legislation—but even then, the benefit I hope to collect one day won’t amount to much on an annual basis, and won’t be anything like the benefit that plan might have provided if only I had remained employed there – for the past 20 years. Instead, like my service with that prior employer, that DB benefit is frozen in time. That result stands in sharp contrast with the 401(k) balances I have accumulated and that continue to grow, despite having changed employers twice since then.

Of course, national tenure data suggest that my job experience was something of an anomaly.  When you consider that median job tenure in the United States  has hovered in the five-to-seven-year range going back to the early 1950s[i], there have doubtless been many private-sector workers who were, for a time, like me, participants in a traditional defined benefit pension plan, only to see little or nothing come of that participation[ii].

I often hear people say that 401(k)s were “never designed to replace pensions,” a reference to the notion that the benefit defined by most traditional pension plans stood to replace a significant amount of pre-retirement income at retirement.  Now, there’s no question that the voluntary nature of the 401(k) programs, as well as their traditional reliance on the investment direction and maintenance by participants, can undermine the relative contribution of the employer-sponsored plan “leg” to a goal of retirement income adequacy.

However, what often gets overlooked in the comparison with 401(k)s is that when you consider the realities of how most Americans work, traditional defined benefit realities frequently fell short of that standard as well. Indeed, in many cases, based on the kinds of job changes that occur all the time, and have for a generation and more, they could provide far less[iii].

In both cases, it’s not the design that’s at fault—it’s how they are used, both by those who sponsor these programs, as well as those who are covered by them.

Nevin E. Adams, JD 

[i] See “Employee Tenure Trends, 1983–2012” available here.  

[ii] And a great number of private-sector workers never participated in a defined benefit plan.  See “Pension Plan Participation” available here.  

[iii] A recent EBRI Issue Brief provides a direct comparison of the likely benefits under specific types of defined contribution (DC) and DB retirement plans. See “Reality Checks: A Comparative Analysis of Future Benefits from Private-Sector, Voluntary-Enrollment 401(k) Plans vs. Stylized, Final-Average-Pay Defined Benefit and Cash Balance Plans”.

Sunday, November 10, 2013

Connecting the Dots

One of my favorite works of art is “A Sunday Afternoon on the Island of La Grande Jatte,” by Georges-Pierre Seurat. I was introduced to this painting in college via an art appreciation class at the Art Institute in Chicago (it even makes a brief appearance in the film “Ferris Bueller’s Day Off”).

The subject matter isn’t really extraordinary―just a group of individuals scattered about a park taking in the scenery. But what amazed me the first time I got close to the painting―and does to this day―is that Seurat created these images, and the marvelous color shadings in these images, through the use of thousands (perhaps millions: the painting itself measures 7 by 10 ft.) of individual dots.

Individual retirement accounts (IRAs) are a vital component of U.S. retirement savings, representing more than 25 percent of all retirement assets in the nation, with a substantial portion of these IRA assets originating in employment-based retirement plans, including defined benefit (pension) and 401(k) plans. Little wonder that those accounts have been a focus of the pending fiduciary regulation re-proposal.

Despite IRAs’ importance in the U.S. retirement system, there is a limited amount of knowledge about the behavior of individuals who own IRAs, alone or in combination with employment-based defined contribution (DC) plans.

Consequently, the Employee Benefit Research Institute (EBRI) created the EBRI IRA Database, which for 2011 contained information on 20.5 million accounts with total assets of $1.456 trillion. When looking across the entire EBRI IRA Database, as of year-end 2011, 44.4 percent of the assets were in equities, 10.7 percent in balanced funds, 18.0 percent in bonds, 13.0 percent in money, and 13.8 percent in other assets―an allocation spread roughly comparable to that found for 401(ks) in the EBRI/ICI 401(k) database at a comparable point in time.

But when you look inside the IRA database, certain interesting aspects emerge. For example, the asset allocation differences between genders were minimal: bond, equity, and money allocations were virtually identical. Moreover, in looking across IRA types, the average equity allocation at each age group was higher for owners of Roth IRAs than for owners of other IRA types―this is perhaps not surprising when you consider that a separate EBRI analysis also revealed that individuals contributing to Roth IRAs tended to be younger. Additionally, as the most recent report reveals, balanced funds have by far the largest asset allocations among young (under age 45) Roth IRA owners.

One might not be surprised to discover that both genders’ average allocations to bonds increased with age (starting at age 25), although the average amount allocated to balanced funds decreased as the age of both genders increased after age 25―with the exception of men ages 75–84. And while equity allocations for genders peaked and then plateaued for those ages 45−54, it then proceeded to INCREASE for male owners age 85 or older.

Of course, an IRA could be only part of an individual’s portfolio of retirement assets: That’s why the goal of the integration of the EBRI databases is to be able to look at the two largest sources of retirement assets (IRAs and DC plans) to examine owner behavior across (as well as within) the accounts to provide a better understanding of the decisions Americans make with their retirement savings.

Because sometimes you need to see the big picture―and sometimes the better understanding of the big picture comes from connecting the dots.

- Nevin E. Adams, JD

The October EBRI Notes article, “IRA Asset Allocation, 2011” is online here. 

Also see “The Generation in Roth IRA Contributions,” online here. 

Sunday, November 03, 2013

Reserve Cause

When I was still a child, my parents owned a 1958 VW Beetle. I was pretty young, so I don’t remember much about that car, other than the color, and what struck me, even as a child, as the “odd” reversal of the trunk and engine. One thing I do remember is that it didn’t have a gas gauge. Instead, there was a reserve tank switch, and when the engine started sputtering, you opened the valve, and got enough “extra” gas to get to a gas station.

The trick was that you had to remember to leave that reserve open when you filled up―if you didn’t, well then, you had no reserve. As you might expect, the reason I remember that relatively obscure feature to this day is a trip that was “interrupted” when my family discovered the hard way that my father had forgotten to reset the reserve switch.

Retirement planning typically focuses on looking to ensure that your post-retirement income sources are adequate to replicate some percentage of your preretirement income level. Underlying that approach is the assumption that individuals incur roughly the same kinds of expenses in retirement, although the amount, and proportionate share, of those expenses can certainly shift, particularly in areas such as health care. Indeed, while EBRI’s Retirement Security Projection Model®  (RSPM) and Retirement Readiness Rating have long incorporated the uninsured costs of post-retirement health care and long-term care, a few other  retirement projection models only recently acknowledge post-retirement health care costs as a discrete retirement savings need.

As a recent EBRI Notes article[1] explains, individuals should be concerned about saving for health insurance premiums and out-of-pocket expenses in retirement for a number of reasons. Medicare generally covers only about 60 percent of the cost of health care services for Medicare beneficiaries ages 65 and older, while out-of-pocket spending accounts for 12 percent.[2] The percentage of private-sector establishments offering retiree health benefits has been falling, and where benefits are offered, they are becoming less generous, even in the public sector.

While EBRI’s analysis indicates that savings targets for post-retirement health expenses (other than nursing home and home health care costs) declined between 6 percent and 11 percent between 2012 and 2013 for a person or couple age 65, there are a wide variety of possible outcomes, depending not only on the age at which an individual retires, but also the length of life after retirement, the availability and source of health insurance coverage after retirement to supplement Medicare, their health status and out-of-pocket expenses, the rate at which health care costs increase, the impact of interest rates and other rates of return on investments, as well as possible changes in public policy―not to mention the targeted probability of success of those targets.

Remember that while it is possible to come up with a single number that individuals can use to set retirement savings goals, a single number based on averages will be wrong for the vast majority of the population.

But, as with that old VW Beetle, those who set savings targets that fail to set aside any reserve for the eventuality might well wind up short of their destination.

Nevin E. Adams, JD

[1] The EBRI Notes article, “Amount of Savings Needed for Health Expenses for People Eligible for Medicare: More Rare Good News” is online here.
 
[2] Note that many individuals will need more than the amounts cited in this report because this particular analysis does not factor in the savings needed to cover long-term care expenses, nor does it take into account the fact that many individuals retire prior to becoming eligible for Medicare. However, some workers will need to save less than what is reported if they choose to work during retirement, thereby postponing enrollment in Medicare Parts B and D if they receive health benefits as active workers.

Sunday, October 27, 2013

"Staying" Power

When we moved into our last home―an old house, and one in which the prior family had lived for quite some time―we found a set of markings on a doorframe.  Markings that appeared to indicate the height―and growth patterns over time―of the children of the former owners.  We took note of this at the time, but those markings didn’t last long after we moved in.  After all, while our kids were still growing, and they were now going to live in the same house, there was little point in assessing their progress against that of the former residents.

We’ve noted before the shortcomings of metrics such as an “average” 401(k) balance (see “Above” Average, online here ), which generally aggregate the balances of participants in widely different circumstances of age and tenure―everything from those just entering the workforce who have relatively negligible 401(k) balances with those who may have been saving for decades.  While these averages can, over time, provide a sense of the general direction in which things are moving, they’re not generally a very accurate barometer when it comes to assessing actual retirement accumulations. That’s one reason why the annual updates of the EBRI/ICI 401(k) database also report average balances by age and tenure.

That said, people change jobs, employers change 401(k) providers, and so, even in a repository as comprehensive and long-standing as the 24-million-participant EBRI/ICI 401(k) database, those “averages,” of necessity, include the experience of different individuals over time.  In order to accurately assess the impact of participation in 401(k) plans over time, and to understand how 401(k) plan participants have fared over an extended period, it is important to analyze a group of consistent participants―a longitudinal sample.

A recent EBRI Issue Brief (jointly published with the Investment Company Institute), “401(k) Participants in the Wake of the Financial Crisis: Changes in Account Balances, 2007–2011,” did just that. Drawing on the actual activity of 8.6 million participant accounts, it found that at year-end 2011, the average 401(k) account balance of the consistent group of participants during 2007‒2011 was $94,482, or 60 percent larger than the average account balance of $58,991 among participants in the entire EBRI/ICI 401(k) database. The median (mid-point) 401(k) account balance among the consistent participants was $42,082 at year-end 2011, about two-and-a-half times the median account balance of $16,649 of participants in the entire EBRI/ICI 401(k) database.

Now, in any given year the change in a participant’s account balance is the sum of several factors: new contributions; total investment return on account balances; and withdrawals, borrowing, and loan repayments.  The influence of each of those factors on individual account balances varied according to individual circumstances; participants who were younger or had fewer years of tenure experienced the largest percentage increases in average account balance between year-end 2007 and year-end 2011, and, for those younger, smaller account balance participants, contributions were responsible for a significant percentage of the growth in their account balances (consistent participants in their 20s saw their accounts nearly triple between 2007 and 2011).  Older participants experienced smaller percentage gains, and most of that was from investment returns.  Moreover, some of those balances were doubtless affected by the initiation of retirement-related withdrawals.

Still, and as the EBRI Issue Brief outlines, the trends in the consistent group’s account balances highlight the accumulation effect―the staying power―of ongoing 401(k) participation.

- Nevin E. Adams, JD

“401(k) Participants in the Wake of the Financial Crisis: Changes in Account Balances, 2007–2011” is available online here.

Sunday, October 20, 2013

Sooner or Later?

On October 16, more than a hundred professionals gathered at the Fall 2013 ASEC Partners’ Meeting to discuss the obstacles to, and possible solutions for, retirement savings.  National Save for Retirement Week is upon us, and America Saves Week will be here before we know it. 

So too, retirement – which seems far away to many, and IS far away for some – often seems to be a far off goal, something that can wait for another day, a more “convenient” time, when we have more free time, and perhaps fewer financial demands.

Indeed, it’s easy, in the normal press of life, to put off thinking about retirement, much less thinking about saving for a period of life many can hardly imagine. We all know we should do it—but some figure that it will take more time and energy than they can afford just now, some assume the process will provide a depressing, perhaps even insurmountable target, and others  - well many don’t even know how to get started.

Here are six reasons why you—or those you care about—should save – and specifically save for retirement – now:

Because you don’t want to work forever.

No matter how much you love your job – or love your job today – that might not always be the case, and you might want the flexibility to make a change on your terms; if not to retire, to cut back on your hours, or maybe even to pursue other interests.  The sooner you’ve made those financial preparations, the sooner that decision can be your choice, rather than one forced upon you.

Because living in retirement isn’t free – and it might cost more than you think.

Many people assume that expenses will go down in retirement, and for some they may.  On the other hand, retirement often brings with it changes in how we spend, and on what – and that’s not necessarily less.  For example, research by the Employee Benefit Research Institute (EBRI) has found that health-related expenses are the second-largest component in the budget of older Americans, and a component that steadily increases with age.  Note also that long-term care (LTC) insurance is a growing area of concern for retirees and, according to government estimates, 12 million older Americans will need LTC by 2020. However, in most cases LTC is not covered by Medicare, and this care is expensive and can be indefinitely long or even permanent.

Because you may not be able to work as long as you think.

The Retirement Confidence Survey (RCS) has, over its 23 year history, consistently found that a large percentage of retirees leave the work force earlier than planned—47 percent in the 2013 RCS, in fact—and many retirees who retired earlier than planned cite negative reasons for doing so, including health problems or disabilities (55 percent); changes at their companies, such as downsizing or closure (20 percent); having to care for spouses or other family members (23 percent).

Some retirees do mention positive reasons for retiring early, such as being able to afford an earlier retirement (32 percent) or wanting to do something else (19 percent), but just 7 percent offer only positive reasons.

Because working longer may not be enough.

One of the more recent alternatives proposed is that of continuing to work longer which, if possible, would serve to both postpone the depletion of retirement income resources, and to provide additional time to save.  As noted above, this assumption might not prove to be a viable option for all, and even for those who can and do, EBRI research has found that even working until 70 by itself may not be sufficient for some individuals.

Because you don’t know how long you will live.

People are living longer and the longer your life, the longer your retirement could last, particularly if, as noted above, it begins sooner than you planned. Retiring at age 65 today? How big a chance do you want to take of outliving your money in old age?

Because the sooner you start, the easier it will be.

What are you waiting for? Sooner or later, you know you need to.  And the later you start, the harder it can be.

- Nevin E. Adams, JD

A good place to start – any time –  is the BallparkE$timate,® and with the other materials available at www.choosetosave.org, as well as www.americasavesweek.org.

For more information on retirement saving and spending, see also:
Income Composition, Income Trends, and Income Shortfalls of Older Households

How Does Household Income Change in the Ten Years Around Age 65?

Spending Adjustments Made By Older Americans to Save Money

Expenditure Patterns of Older Americans, 2001-2009

Sunday, October 13, 2013

Motive and Opportunity

At some point in just about every police drama, potential suspects are vetted against the following criteria: Did they have the motive to commit the crime, and did they have the opportunity? Those who lack either are generally quickly dismissed as suspects because it is assumed that, lacking those two essential elements, they simply couldn’t—or wouldn’t—have done the crime.

While it’s not generally couched in such terms, the focus on remedying retirement savings shortfalls often turns on those elements as well. Granted, most individuals would concede they have a motive for saving for retirement. After all, how many of us would consciously embrace the notion of a less-than-financially secure retirement, given a choice?

Opportunity is another matter. We know that, given the opportunity to save in a workplace retirement plan, most do. However, we also know that, outside those workplace programs—despite a wide-range of available alternatives—the vast majority do not.

Not surprisingly, this “coverage gap”—between those who have access to a retirement savings plan at work and those who don’t—has been a focus of regulators and policymakers, with some looking for ways to encourage more employers to provide access to such plans, and others looking to expand access through approaches like “automatic” IRAs.

When it comes to evaluating criminal suspects, there is a third criterion applied, and one that is often the final determinant in deciding whether to charge the individual: Did they have the MEANS to commit the crime? The rationale is simple: While one can have both the motive to injure someone and the opportunity to do so, if you lack the physical means to commit the crime—well, then, even if you had the inclination and the chance, you lacked the physical wherewithal to do so. And means is, of course, also a critical consideration in the calculus of retirement savings, certainly among lower-income workers.

You’ve got the motive and the means—take advantage of the opportunity.

- Nevin E. Adams, JD

The American Savings Education Council, or ASEC, is a national coalition of public- and private-sector institutions committed to making saving and retirement planning a priority for all Americans, which it does through resources such as the Ballpark E$timate. ASEC is a program of the Employee Benefit Research Institute Education and Research Fund (EBRI-ERF), a 501©(3) non-profit organization.  More information is available at www.asec.org

Sunday, October 06, 2013

"After" Images

“Replacement rates”—roughly defined as the percentage of one’s pre-retirement income available in retirement—arguably constitute a poor proxy for retirement readiness.

Embracing that calculation as a retirement readiness measure requires accepting any number of imbedded assumptions, not infrequently that individuals will spend less in retirement. While there is certainly a likelihood that less may be spent on such things as taxes, housing, and various work-related expenses (including saving for retirement), there are also the often-overlooked costs of post-retirement medical expenses and long-term care that are not part of the pre-retirement balance sheet.

That said, replacement rates are relatively easy to understand and communicate, and, as a result, they are widely used by financial planners to facilitate the retirement planning process. They are also frequently employed by policy makers as a gauge in assessing the efficacy of various components of the retirement system in terms of providing income in retirement that is, at some level, comparable to that available to individuals prior to retirement.

A recent EBRI analysis looked at a different type of measure, one focused on the years prior to the traditional retirement age of 65, specifically a post-65 to pre-65 income ratio. The analysis was intended to provide a perspective on household income five and 10 years prior to age 65 compared with that of household income five and 10 years after age 65, specifically for households that didn’t change marital status during those periods. Note that in some households at least one member continues to work after age 65 (part-time in many cases) and may not fully retire until sometime after the traditional retirement age of 65.

Based on that pre- and post-65 income comparison, the EBRI analysis finds that those in the bottom half of income distribution did not experience any drop in income after they reached 65, although the sources of income shifted, with drops in labor income offset by increases in pension/annuity income and Social Security.

That was not, however, the case for those in the top-income quartile, who experienced a drop in income as they crossed 65, with their post-65 income levels only about 60 percent of that in the pre-65 periods.

This is not to suggest that the lower-income households were “well-off” after age 65. Changes in marital status, not considered in this particular analysis, particularly in the years leading up to (and following) retirement age, can have a dramatic impact on household income.

The current analysis does, however, show that Social Security’s progressivity is serving to maintain a level of parity for lower-income households with household income levels in the decade before reaching age 65, and in some cases to improve upon that result—and it helps underline the significance of the program in providing a secure retirement income foundation.

- Nevin E. Adams, JD

The EBRI report, published in the September EBRI Notes, “How Does Household Income Change in the Ten Years Around Age 65?” is available online here.

Sunday, September 29, 2013

System "Upgrades"

I recently upgraded the operating system on my iPhone. Not that that would normally be a big deal—I generally try to keep such things current, despite the occasional “bumps” that inevitably come with software upgrades. But this time the upgrade wasn’t just about improving performance and fixing issues that had been identified since the last update.  No, this one not only LOOKED different, some core functions were said to work differently—and “different” in this case appeared to be a problem for a number of users.

So, before I took the “plunge,” I spent some time trying to do some research—trying to find out what kinds of improvements I could anticipate, and to better understand the complaints associated with an upgrade from which there was, apparently, no “return.” The upgrades were readily quantified (on the vendor’s website most notably), although I think it’s fair to say they had a motivation in promoting the new system. However, most seemed to be relatively unimportant in terms of how I used, or planned to use, my device. As for the problems: Well, they were equally easy to find, but harder to quantify. And, like those product ratings on any website, were from people I did not know and whose judgments I had no particular reason to trust.

Consequently, stuck between conflicting perspectives, and seeing no particular advantage in making a change, I did what most human beings do. Nothing. Until, with my current contract expiring, I realized that the upgrade was likely to be imposed on me at that point, regardless of my preferences.

On October 1, the public marketplaces (formerly known as connectors or exchanges) associated with the implementation of the Patient Protection and Affordable Care Act (PPACA) will begin to come online—in various phases and, from what one can discern from published reports and official updates, in various states of readiness. The advantages have been outlined, as have the potential pitfalls. Doubtless the experiences will be as varied as the experience(s) and expectation(s) of the individuals involved.

However, it’s hardly a new idea. Back in 1980 the conservative Heritage Foundation began advocating that the Federal Employee Health Benefit Program (FEHBP—a marketplace for multiple insurers and scores of plan options) become a model for expansion of health coverage through an individual mandate. Today, simply telling those in Washington, DC, that “the marketplaces are just a version of FEHBP” brings an immediate understanding of the concept.

A year ago, EBRI published an Issue Brief that outlined the issues related to private health insurance exchanges, possible structures of an exchange, funding, as well as the pros, cons, and uncertainties to employers of adopting them. That report contained a summary of recent surveys on employer attitudes, as well as some changes that employers have made to other benefits that might serve as historical precedents for a move to some type of defined contribution health benefits approach. It is a report that provides both current analysis alongside a historical perspective—a resource for those looking to better understand and plan for the potential changes ahead.¹

That said, when Paul Fronstin, EBRI’s director of Health Research and the EBRI Center for Research on Health Benefits Innovation, updates the information in the future, he may well call them marketplaces, unless the name “upgrades” again in the weeks ahead!

Nevin E. Adams, JD

¹ See “Private Health Insurance Exchanges and Defined Contribution Health Plans: Is It Déjà Vu All Over Again?” online here.

You can find a catalogue of recent EBRI research on PPACA and its potential impact on employment-based health benefits online here.

Sunday, September 22, 2013

Future Tense?

Americans have long had a beef of sorts with the U.S. health care system.

Asked to rate that system, a majority of workers describe it as poor (21 percent) or fair (34 percent), and while nearly a third consider it good, and less than half that many rate it as very good (12 percent) or excellent (2 percent), according to the 2013 Health and Voluntary Workplace Benefits Survey (WBS). Perhaps more significantly, the percentage of workers rating the health care system as poor doubled between 1998 and 2006, according to the 1998–2012 Health Confidence Survey (HCS).

On the other hand, workers’ ratings of their own health plans continue to be generally favorable. In fact, one-half (51 percent) of those with health insurance coverage are not just content with the coverage they have, they are extremely or very satisfied with it.

Satisfaction with health care quality continues to remain fairly high, with 50 percent of workers saying they are extremely or very satisfied with the quality of the medical care they have received in the past two years.

In fact, dissatisfaction with the health care system appears to be focused primarily on cost: Just 13 percent are extremely or very satisfied with the cost of their health insurance plans, and only 11 percent are satisfied with the costs of health care services not covered by insurance.

And, despite the ongoing (and frequently dramatic) news coverage of changes (current and contemplated) resulting from the Patient Protection and Affordable Care Act (PPACA), workers continue to be generally confident that their employers or unions will continue to offer health insurance. In 2013, 28 percent of workers report that they are extremely confident their employers or unions will continue to offer coverage, 37 percent are very confident, and 28 percent are somewhat confident.

On the other hand, confidence about the health care system decreases as workers look to the future. While 46 percent of workers indicate they are extremely or very confident about their ability to get the treatments they need today, just 28 percent are confident about their ability to get needed treatments during the next 10 years; and while 39 percent are confident they have enough choices about who provides their medical care today, fewer than-  1 in 4 are confident about this aspect of the health care system over the next 10 years.

Finally, 25 percent of workers say they are confident they are able to afford health care without financial hardship today, but this percentage decreases to 18 percent when they look out over the next decade.

Ultimately, the findings of the 2013 Health and Voluntary Workplace Benefits Survey provide not only valuable insights into how Americans view and value their health care now, but also a sense that the current comfort and confidence levels could be relatively short-lived.

- Nevin E. Adams, JD

“The 2013 Health and Voluntary Workplace Benefits Survey: Nearly 90% of Workers Satisfied With Their Own Health Plan, But 55% Give Low Ratings to Health Care System” is available online here.

Sunday, September 15, 2013

Thinking "Caps"

In this era of “reality” TV, where the “antics” (and worse) of the formerly rich and infamous are on display in ways that could not even have been imagined a decade ago, I seem to find myself increasingly shaking my head and muttering “what were they thinking?” The answer, as often as not, seems to be “they weren’t.”

And some, looking at the retirement savings behaviors and expectations of the American workforce over the years, might well wonder—and perhaps respond—the same way.

Whether you are an employer trying to motivate workers to avail themselves of a new benefit (or to better utilize an existing one), an advisor looking to improve their portfolio diversification, a provider interested in expanding acceptance of your product set, or a regulator trying to fine-tune (or overhaul) the current legal boundaries, sooner or later you find yourself wanting (perhaps NEEDING) to know “what are ‘they’ thinking?”

In just a few weeks, we’ll begin development of the 24th Retirement Confidence Survey, the longest-running annual retirement survey of its kind in the nation. As you might expect, the survey contains a core set of questions that is asked annually, allowing key attitudes and self-reported behavior patterns to be tracked over time. We ask both workers and retirees about their confidence in their retirement income prospects, including Social Security and Medicare; how much money have they saved for their future and where they are putting their money; who they turn to for retirement investment information and advice; and seek insights on why they are not saving more and what would motivate them to do so. The survey also allows us to gain the perspective on those issues from those already in retirement, providing an invaluable reality “check” between active workers and current retirees on expectations such as retirement age, spending, and retirement financial needs.

We’ve also asked forward-looking questions, tried to gauge worker interest in using technology, social media, and various investment products to manage their retirement accounts, and gotten valuable insights on how specific regulatory and legislative changes might affect their future savings behavior—insights that we’ve been able to incorporate with our extensive databases and modeling capabilities to quantify the potential impact on overall retirement savings and security.

In a very real sense, the Retirement Confidence Survey provides a unique window through which we can both examine long-term trends and sentiments, and still glean a sense of the future—an appreciation both for what has been, and for what might yet be.

It’s a chance to find out not only “what are they thinking?” but uncover the actions that could influence, if not drive better behaviors in the future.

- Nevin E. Adams, JD

If your organization would like to participate in the design of the 2014 Retirement Confidence as an underwriter, please contact me at nadams@ebri.org  Underwriters not only provide input on the survey questions, but have access to the raw data, are briefed on its findings prior to publication; have the ability to utilize the survey materials and findings for research, marketing, communications, and product-development purposes; and are acknowledged as underwriters in the final survey report.

More information about the Retirement Confidence Survey, as well as links to previous iterations of the RCS, are available at http://www.ebri.org/surveys/rcs/

Sunday, September 08, 2013

"Some" Totals

There’s an old tale about a group of men that are blindfolded and then asked to describe an object (in the story, an elephant, though they don’t know what it is), based on their individual observations. In doing so, each one grasps a different part, but only one part, such as the side, the trunk, the tail, the ear, or a tusk.

Following their individual assessments of what is ostensibly the same object, they compare notes―and are puzzled to find their conclusions about the object’s appearance to be in complete disagreement.

A recent EBRI Notes article¹ examined retirement plan participation through the prism of data from the Survey of Income and Program Participation (SIPP), which is conducted by the U.S. Census Bureau to examine Americans’ participation in various government and private-sector programs that relate to their income and well-being.

Now, as the EBRI analysis notes, the SIPP data have the advantage of providing relatively detailed information on workers’ retirement plans, but SIPP is fielded only once every three to five years. By comparison, the Current Population Survey (CPS), which is also conducted by the U.S. Census Bureau, provides overall participation levels of workers on an annual basis, but the CPS does not provide information on the specific types of plans in which the workers are participating. Another data source is the Bureau of Labor Statistics’ (BLS) National Compensation Survey, which annually surveys establishments’ offerings of employee benefit programs, including retirement plans―but at an employee level it includes information only on occupation, union status, and part-time/full-time work, and no information on age, gender, or race/ethnicity. Consider also that the CPS collects information about anyone who worked at any point in a previous year, while SIPP and BLS ask only about current workers in the month of interest.

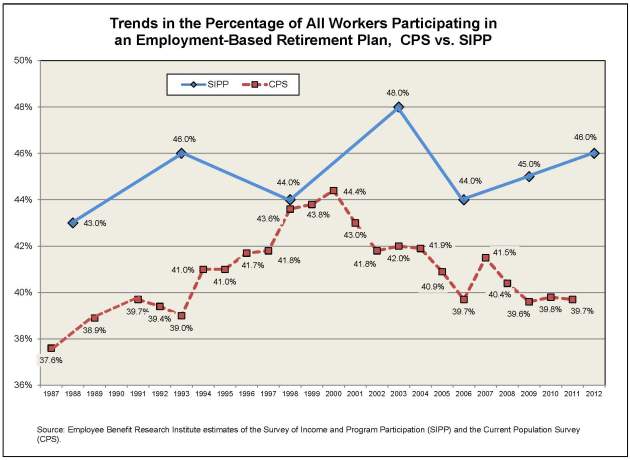
As you can see, each of these national (and widely cited) surveys collects data in a different manner, at different times, and has different questions that can lead to different conclusions. Consider the chart below. The top line shows retirement plan participation rates for all workers from SIPP, and the lower line graphs retirement plan participation, also for all workers, from the CPS. While the trend lines generally move in the same direction, the more frequent CPS data allows us to see the more incremental movements―and to see a drop in participation rates in 2000–2002 following the burst of the tech bubble that would be completely missed looking only at the SIPP results. Moreover, relying strictly on SIPP data, one might well be inclined to see an increase in participation rates, rather than the leveling off that we see based on CPS data.²

That said, each survey provides important data that can’t be found elsewhere: CPS has the annual participation data with a complete set of worker demographics, while SIPP has the complete set of worker demographics plus retirement plan types, and BLS has detailed data on establishment characteristics, along with retirement plan type, although with limited worker demographics.

There was nothing inherently wrong in the individual observations made by the three blind men in the story―other than their examinations focused on one particular attribute, rather than appreciating the reality that a truly accurate assessment required looking at ALL the pieces, rather than each in isolation.

Similarly, and as the EBRI analysis concludes, those who would draw conclusions from individual surveys or datasets are well-advised to benchmark those results against other data, lest they conclude that the elephant(s) in the room are different than they truly are.

Nevin E. Adams, JD

NA.Blog.Sept6.Fig

¹ See “Retirement Plan Participation: Survey of Income and Program Participation (SIPP) Data, 2012,” online here.

² Another potential limitation of these surveys is that they are based on self-reported information, which is to say they rely on respondents’ recollections, rather than actual administrative plan data or IRS tax records. For SIPP specific results, see, for example, Irena Dushi, Howard M. Iams, and Jules Lichtenstein, “Assessment of Retirement Plan Coverage by Firm Size, Using W-2 Tax Records,” Social Security Bulletin, Vol. 71, No. 2, 2011, pp. 53–65, online here.

Sunday, September 01, 2013

How Much Would You Pay?

Growing up, I remember late night television being broken up by commercials touting a series of interesting products, everything from a rod-and-reel contraption that would fit in your pocket to a special set of knives that would, apparently, slice through any substance in the known universe without ever being sharpened. But unlike the commercials that ran during prime time, having made the pitch, the announcer lead viewers through a series of additional product extensions, generally with the admonition, “but wait, there’s more…”

Even with all that buildup, as the commercial closed viewers were reminded of the features of the product, and then asked, “Now, how much would you pay?” as several possible prices were suggested, then crossed off before being informed of the actual price (“plus shipping and handling”). And then, to close the deal, viewers were frequently told that they could have a SECOND version of the product for the same price (“just pay shipping and handling”).

I’m happy to say that I considered buying more of those offerings than I actually bought (albeit somewhat embarrassed to admit to how many I HAVE purchased over the years). The lessons I learned early on were that the product never worked nearly as well at home as it did on television, that you almost never had a good use for the second “at no additional charge” copy, and that when you added up ALL the costs, you frequently found out a sizeable gap between what you thought you were paying, and the actual bill.

Earlier this year, as part of its 2014 budget proposal, the Obama administration included a cap on tax-deferred retirement savings that would limit the amounts that could be accumulated in specified retirement accounts―which covers most of the ERISA-qualified plan universe (401(a), 401(k), 403(b), certain 457(b), as well as individual retirement accounts (IRAs), and―to the surprise of many―defined benefit pension plan accruals, as well.

The proposal would limit the amount(s) accumulated in these accounts to that necessary to provide the maximum annuity permitted for a tax-qualified defined benefit plan under current law, currently an annual benefit of $205,000 payable in the form of a joint and 100 percent survivor benefit commencing at age 62. This, in turn, translates into a maximum permitted accumulation for an individual age 62 of approximately $3.4 million (a number that many of the initial media reports carried) at the interest rates prevailing when the proposal was released. And, certainly initially, most of the analysis of the proposal’s impact―including that from EBRI’s own unique and extensive databases―was focused on how many individuals had accumulated account balances in excess of that $3.4 million today.

But, taking a longer view, and using our proprietary Retirement Security Projection Model,® EBRI’s simulation results for 401(k) participants (assuming no defined benefit accruals and no job turnover) show that more than 1 in 10 current 401(k) participants are likely to hit the proposed cap sometime prior to age 65―even at today’s historically low discount rates. If you assume discount rates closer to historical averages, the percentage likely to be affected increases substantially.

As part of the analysis published in the August 2013 Issue Brief,¹ EBRI Research Director Jack VanDerhei also looked at the potential impact of the proposed cap based on two stylized, final-average defined benefit plans and a stylized cash balance plan, along with a number of different discount rate assumptions. As an example, assuming coverage by a defined benefit plan providing 2 percent, three-year, final-average pay benefits, with a subsidized early retirement at 62, and assuming an 8 percent discount rate, nearly a third are projected to be affected by the proposed limit.

VanDerhei also looked at the potential response of plan sponsors, specifically smaller 401(k) plans (those with less than 100 participants), whose owners might reconsider the relative advantages of continuing the plans, particularly in situations where that owner of the firm believes that the relative cost/value of offering the plan is significantly altered such that the benefit to the owner is reduced. Since these owners (and their personal circumstances) can’t be gleaned directly from the data, some assumptions had to be made. But, depending on plan size, the EBRI analysis indicates this could involve as few as 18 percent of the small firms (at a 4 percent discount rate) or as many as 75 percent of the small firms (at an 8 percent discount rate).

The administration’s budget proposal estimated that the retirement savings cap would generate an additional $9 billion in revenue. But the question―and one that the EBRI analysis helps policy makers answer, and for a wide range of possible outcomes―is “how much would it cost?”

Nevin E. Adams, JD

¹ See “The Impact of a Retirement Savings Account Cap,” online here.

Sunday, August 25, 2013

"Lead" Times

There’s an old saying that you can “lead a horse to water, but you can’t make him drink.” It’s a sentiment expressed by many a benefits manager who has devoted significant time and effort to plan design, only to find the adoption rate by individual workers to be “disappointing.” And yet, in the retirement savings context, there’s ample evidence that individuals who have access to a savings plan at work do, in large part, take advantage of that opportunity.

Consider that average participation rates in excess of 70 percent are commonly reported in industry surveys, and that’s for plans that don’t take advantage of automatic enrollment. Moreover, previous EBRI research has pointed out that merely having access to a defined contribution plan at work can have a significant positive impact on one’s retirement readiness rating, simply because it greatly enhances the likelihood that those individuals WILL participate (1).

Those who say that you can only “lead a horse to water” might well expect that a horse will drink when it’s thirsty, or when it needs water—but equine experts will tell you that many horses refuse to drink when they need to most, especially in times of competition, illness, travelling or stress. So, while you may not be able to make them drink, it’s generally important for their health and well-being to find ways to encourage them to do so—adding a little salt in their diet, for instance, or putting an apple in their water bucket.

Similarly, all workers don’t have access to retirement plans at work, and those who do don’t always take full advantage of it—with some saving below the employer match levels of their plan, many older workers failing to take advantage of catch-up contributions, and a number of automatically enrolled workers leaving those relatively low initial default contribution rates in place.

There are, however, steps employers can take to help: Prior EBRI research has documented the profound influence of plan design variables, as well as employee behavior in auto-enrollment 401(k) plans (2). Not only the impact that automatic enrollment can have on retirement readiness, but what setting that initial default rate at 6 percent, rather than the “traditional” 3 percent (now codified in the Pension Protection Act of 2006) could mean in terms of improving retirement readiness “success.(3)

For example, using actual plan-specific default contribution rates, and assuming an automatic annual deferral escalation of 1 percent of compensation; that employees opted out of auto-escalation at the self-reported rates from the 2007 Retirement Confidence Survey; and that they “started over” at the plan’s default rate when they changed jobs and began participation in a new plan; along with the assumption that the plan imposed a 15 percent cap on employee contributions, the EBRI analysis found that more than a quarter (25.6 percent) of those in the lowest-income quartile who had previously NOT been successful (under the actual default contribution rates) would then be successful (4) as a result of the change in deferral percentage.

As benefit plan professionals know, and as EBRI research has quantified, plan design can be effective at doing more than just leading workers to the opportunity to save for retirement—it can help them make decisions that improve their chances of success.

Nevin E. Adams, JD

[1] See “’Retirement Income Adequacy for Today’s Workers: How Certain, How Much Will It Cost, and How Does Eligibility for Participation in a Defined Contribution Plan Help?” online here.  

[2] See “The Impact of Automatic Enrollment in 401(k) Plans on Future Retirement Accumulations: A Simulation Study Based on Plan Design Modifications of Large Plan Sponsors,” online here.  

[3] See “Increasing Default Deferral Rates in Automatic Enrollment 401(k) Plans: The Impact on Retirement Savings Success in Plans With Automatic Escalation,” online here.  

[4] In this case, success equals a real replacement rate of 80 percent or more when combined with Social Security.

Sunday, August 18, 2013

The Long Haul

A recent long-distance family member move required that I rent a vehicle larger than the passenger cars that we generally rely on for transportation.  There were a number of considerations: cost, availability, the opportunity to drop off the vehicle on the other end, and the actual size of the vehicle. 

I don’t really have much experience with such determinations; honestly, the carrying dimensions of the vehicle were posted, but I had no real idea how to equate what I needed to transport with those criteria.  I knew the individual pieces (certainly the large ones), but as you might imagine, they were of various shapes, sizes and weights, and worse, what needed to be carried was in multiple locations, which made it even more difficult to make a proper estimation.

That said, I made my best guess – chose one that seemed big enough to handle the load but that was still small enough for me to handle comfortably – reserved the vehicle and waited for the pickup day to arrive.

The day before I was due to pick up the vehicle, I got an email from the rental company telling me that they had decided to upgrade my rental to a larger vehicle, at no additional cost to me.  Now, I’m sure they felt they had done me a big favor.  But what they had actually done, despite my very careful planning – and just 24 hours prior to the move – was to give me a vehicle that was not only larger than I needed, but one that was very likely beyond my driving capabilities, certainly over the distances I had to travel.

Planning for retirement is often compared to preparing for a big trip – trying to figure out what you’ll need for the journey, estimating the fuel you’ll need – but ultimately not being precisely sure at the outset how long the trip will last.  Those who sit down to make the calculation – and, according to the Retirement Confidence Survey1, many still haven’t – may find it hard to match the components of their retirement income with the needs of their retirement journey, certainly without the assistance of a retirement planning calculator (such as the Ballpark E$timate®2) or a professional advisor’s expertise.  Indeed, recent EBRI research indicates that individuals who take advantage of either resource set more adequate savings goals3.

Still, things change, and life has a way of throwing unexpected things in our path; even the well-laid plans of a few years ago are well-served by revisiting both the underlying assumptions and the projected needs.  Because, after all, you never know what you’ll have to deal with over the long haul.

Nevin E. Adams, JD

1 Workers often guess how much they will need to accumulate (45 percent), rather than doing a systematic, retirement needs calculation, according to the RCS, while 18 percent indicated they did their own estimate, another 18 percent asked a financial advisor, 8 percent used an on-line calculator, and another 8 percent read or heard how much was needed.

2 A great place to start figuring out what you’ll need is the Ballpark E$timate®, available online at www.choosetosave.org.  Organizations interested in building/reinforcing a workplace savings campaign can find a variety of free resources there, courtesy of the American Savings Education Council (ASEC).  Choose to Save® is sponsored by the nonprofit, nonpartisan Employee Benefit Research Institute Education and Research Fund (EBRI-ERF) and one of its programs, the American Savings Education Council (ASEC). The website and materials development have been underwritten through generous grants and additional support from EBRI Members and ASEC Partner institutions.

3 See “A Little Help: The Impact of On-line Calculators and Financial Advisors on Setting Adequate Retirement-Savings Targets: Evidence from the 2013 Retirement Confidence Survey,” online here

Sunday, August 11, 2013

The Bigger Picture

Over the weekend, my daughter shared with us an insurance quote she’d received.  It had been a while since I had focused on such things, but I was struck first by how much it was.  It was for insurance in a different state, so we worked through the particulars, trying to be certain that we understood what was covered, matched that against her needs.  Ultimately, while much of the quote made sense, there were a couple of items that seemed too high.

As we probed those items, my daughter explained that the agent had made an effort to match those levels against her current coverage.  A logical enough inquiry and starting point, but one that (apparently) failed to take into account that her current coverage – as part of our family policy – would be quite different from what she needed on her own.  The agent got an accurate response to the question he asked – but it wasn’t the right question.

Individual Retirement Accounts, or IRAs, hold more than 25 percent of all retirement assets in the United States, which makes them a vital component of the nation’s retirement savings.  In fact, as an account type, IRAs currently hold the largest single share of U.S. retirement plan assets.  There are, however, different types of IRAs, and, according to a recent EBRI analysis[i], they differ in a number of ways.

For example, in the EBRI IRA Database[ii], which contains data collected from various IRA plan administrators on 20.5 million accounts, with total assets of $1.456 trillion, most of the new IRA contributions go into Roth IRAs, but most of the assets are held in traditional IRAs, where, as noted above, the money frequently originated from a rollover from other tax-qualified retirement plans (such as 401(k) plans).  In fact, the latest report from the EBRI IRA Database finds that 26 percent of Roth IRA owners contributed to their accounts in 2011, compared with just 6 percent of traditional IRA owners.

On the other hand, individuals with a traditional IRA originating from rollovers had the highest average and median (mid-point) balances ($110,918 and $31,944, respectively, compared with Roth average and median balances at $25,228 and $11,344) – and in the 2011 EBRI IRA Database, almost 13 times the amount of dollars were added to IRAs through rollovers as from new contributions.

Roth IRAs had a higher percentage of younger individuals contribute to them: 23.8 percent of the Roth accounts receiving contributions were owned by individuals ages 25–34, compared with 8.9 percent for traditional IRAs.  Moreover, Roth IRA owners were both more likely to contribute to their IRA and more likely to contribute in subsequent years – and those who are younger and own a Roth IRA were more likely to contribute to it than older Roth IRA owners.

While they account for nearly one in five of the accounts in the EBRI IRA Database, Roth IRAs represented only 7 percent of the $1.456 trillion in assets at year-end 2011.  Still, it’s easy to imagine how the trend differences highlighted above could, over time, impact key trends in terms of contributions, asset allocation, and withdrawal patterns[iii].

Research sometimes suffers from a tendency to extrapolate big conclusions from remarkably small samples.

On the other hand, the EBRI IRA database, with millions of individual account records drawn from multiple account providers, allows us to see the big picture, as well as the details that underlie, and perhaps shape, the longer-term trends.

Nevin E. Adams, JD

[ii] The EBRI IRA Database contains data collected from various IRA plan administrators on 20.5 million accounts owned by 16.6 million unique individuals with total assets of $1.456 trillion. EBRI is building a database that will allow it to track the flow of retirement assets saved in 401(k) plans and other tax-qualified plans and transferred to IRAs and spent in retirement as people leave the work force.

[iii] The EBRI IRA Database is also unique in its ability to track people who own multiple IRAs, providing a measure of individuals’ consolidated IRA holdings. For instance, it shows that the overall cumulative IRA average balance was 24 percent larger than the unique account balance, providing a far more accurate picture of the assets held in these accounts by individuals.