Sunday, September 30, 2012

Starting (Over) Points

Earlier this week, an EBRI research report quantified the financial impact of setting a higher starting point for 401(k) default contributions—and it can be significant.

Most private-sector employers that automatically enroll their 401(k) participants do so at a default rate of 3 percent of pay,(1) a level consistent with the starting rate set out in the Pension Protection Act of 2006 as part of its automatic enrollment safe harbor provisions—but it’s a rate that many financial experts acknowledge is far too low to generate sufficient assets for a comfortable retirement.

EBRI has previously modeled the impact of automatic enrollment(2) (see “The Impact of Automatic Enrollment in 401(k) Plans on Future Retirement Accumulations: A Simulation Study Based on Plan Design Modifications of Large Plan Sponsors,” online here). In the most recent research, using EBRI’s proprietary Retirement Security Projection Model® (RSPM), the impact of raising the default contribution rate to 6 percent for younger workers (who might have 31–40 years of simulated 401(k) eligibility) in plans with automatic enrollment and automatic escalation was evaluated to see how many would be likely to achieve a total income real replacement rate of 80 percent at retirement.

As noted earlier, the higher starting default made a significant impact; more than a quarter of those in the lowest-income quartile who had previously NOT been simulated to have reached the initial replacement rate target (under the actual default contribution rates) would reach the target as a result of the increase in raising the starting deferral rate to 6 percent of compensation. Even those in the highest-income quartile would benefit, although not as much.(3)

But what about when those workers change jobs: Would they “start over” at the new employer’s starting default rate, or would they “remember” and carry their higher rate of savings at their prior employer into the new plan? The modeling actually looked at both those scenarios,(4) and found that 15–26 percent of the lowest-income quartile that would otherwise not have reached the target threshold under their existing plan-specific deferral rates would now do so at the 6 percent level, as would 13–22 percent of those in the highest-income quartile.

In life, “starting over” can be a painful, awkward process, as anyone who’s restarted a career or home can attest. But, depending on where you are starting from—and what kind of start you make—it can also be an opportunity.

- Nevin E. Adams, JD

(1) Which, it should be noted, also contemplates an annual 1 percent automatic escalation of that starting rate, up to a designated level. Neither the automatic enrollment nor automatic escalation provisions are mandated by the legislation, unless the plan sponsor wants to take advantage of the PPA safe harbor protections.

(2) One point that had been made clear in previous research was that some workers who were defaulted into a 401(k) auto-enrollment (AE) plan (without auto-escalation provisions) would continue to contribute at the defaulted contribution rate chosen, typically in the range of 3 percent of compensation. Traditionally, and in the absence of these AE provisions, many workers eligible for workplace retirement savings plans have voluntarily elected to start contributing at a 6 percent rate (a point commonly associated with the level of matching contribution incentive provided by employers). However, some participants in AE plans—who otherwise might have voluntarily chosen to participate at a higher contribution level—instead might simply allow their savings to start (and remain) at the default rate. As a result, they were likely contributing at a lower rate than if they had been working for a plan sponsor offering a voluntary enrollment (VE) 401(k) plan AND had made a positive election to participate.

(3) The modeling assumed actual plan-specific default contribution rates with (1) an automatic annual deferral escalation of 1 percent of compensation; (2) that employees opted out of that auto-escalation at the self-reported rates from the 2007 Retirement Confidence Survey findings; (3) that they “started over” at the plan’s default rate when they changed jobs and began participation in a new plan; and (4) that the plan imposed a 15 percent cap on employee contributions.

(4) Among other criteria, the modeling also considered auto escalation rates of 1 percent and 2 percent.

Sunday, September 23, 2012

Question “Mark”

Next month we’ll enter the final full month of the 2012 election cycle with a series of presidential (and one vice presidential) debates. Pundits claim these don’t have much impact on the election’s outcome, but millions of Americans will likely tune in anyway, either to help them make a decision, to reinforce the one they made months ago, or perhaps just for the prospect of seeing a historic gaffe. The answers, of course, will receive the most scrutiny, though as any journalist (or pollster) will tell you, the art lies in asking the “right” question.

In the not-too-distant future, EBRI will, in conjunction with Matt Greenwald & Associates, Inc., field the 2013 Retirement Confidence Survey.¹ Over its 23-year history, the RCS has examined the attitudes and behavior of American workers and retirees toward all aspects of saving, retirement planning, and long-term financial security. The survey itself—the longest-running survey of its kind in the nation—is meaningful both for the kinds of issues it deals with and the trends it measures: It’s tracked a “new normal,” where workers adjust their expectations about the transition to retirement; examined both age and gender differences on saving and planning for retirement; tracked attitudes about Social Security and Medicare; and compared expectations about retirement to the realities.²
Not surprisingly, coverage of the survey by the media continues to be quite extensive. The 2012 RCS was released on March 13, 2012,³ and partial tracking (to Sept. 5, 2012) found the 2012 RCS mentioned in 50 newspapers, 26 periodicals, 35 web-based outlets, 22 broadcast outlets (including CNN Money, CNBC.com, and CBS News), as well as eight newswire services.

Significantly, the RCS doesn’t merely deal with confidence as a “feeling,” but also at the criteria that underlie and influence that sentiment. It looks at the perspective both of those already in retirement, as well as those still working and heading toward that milestone, and does so with the perspective of research that has focused on those issues for more than two decades. It also (with a perspective based on more than 20 years of conducting this particular survey) offers insights on how those feelings and factors have changed over time.

From past experience, we know that how individuals view—and anticipate—retirement can have a dramatic impact on that reality. Each year the RCS research team, in collaboration with the survey’s advisory board of underwriters, meets to consider not only past trends and the present environment, but also future developments, as we seek to craft the right set of questions to help explore and expand our collective understanding of these critical issues.

As with many things in life, when it comes to planning for retirement, it’s hard to know what the right answer is if you aren’t asking the right questions.

P.S. The Retirement Confidence Survey is funded through subscriptions. In 2012, there were 26 subscribers (see the full list online here), which keeps the cost down to $7,500 per subscriber. If you’re interested in supporting and being part of the planning for the 2013 RCS, please email me.

Nevin E. Adams, JD

¹ The need and demand for reliable data about America’s retirement system, and worker/retiree post-career readiness for retirement has never been greater. If you’d like to know more, or participate as an underwriter of this important survey, please email Nevin Adams. A list of the 2012 RCS Underwriters is available online here.

² Information from prior editions of the Retirement Confidence Survey is available online here.

³ Data from the 2012 RCS is available online here.

Sunday, September 16, 2012

“Last” Chances

While many Americans seem to lack a definitive sense of what living in retirement will be like, how long it will last, or how much it will cost, their sense of when it will begin has been trending older. The 2012 Retirement Confidence Survey (RCS) noted that, whereas in 1991, just 11 percent of workers expected to retire after age 65, in 2012, more than three times as many (37 percent) report they expect to wait until after age 65 to retire—and most of those indicated an expected retirement age of 70 or older.1

Those expecting to delay retirement perhaps found solace in a recent report by the Center for Retirement Research (CRR) at Boston College which concluded that by postponing retirement until age 70, the vast majority of households (86 percent) were “…projected to be prepared for retirement.”

That sounds good – but what about the assumptions underlying that conclusion?

In 2003, the Employee Benefit Research Institute (EBRI) constructed the EBRI-ERF Retirement Security Projection Model® (RSPM)—the first nationally representative, micro-simulation model based on actual 401(k) participant behavior and a stochastic decumulation model. And though we have explicitly recognized that many individuals were retiring at earlier ages, a retirement age of 65 was chosen for baseline results, based upon the assumption that most workers would have the flexibility to work until that age, if they so chose.

Last year we modified the RSPM to determine whether just “working a few more years after age 65” would indeed be a feasible financial solution for those determined to be “at risk.” Unfortunately, for those counting on that as a retirement savings “solution”, the answer is not always “yes.”

Indeed, results from the EBRI modeling indicated that the lowest pre-retirement income quartile would need to defer retirement to age 84 before 90 percent of the households would have even a break-even (50‒50) chance of success.

Working longer does help, of course. A recent EBRI Notes article titled “Is Working to Age 70 Really the Answer for Retirement Income Adequacy?2” finds that 23 percent of those who would have been at risk of running out money in retirement if they retired at age 65 would be “ready to retire” if they kept working to 70. Better still, if those individuals are assumed not only to delay retirement, but also to keep participating in a defined contribution plan, a full third of those who would have been at risk of running short of money if they retired at age 65 would be “ready” to retire at age 70.3

What accounts for the difference in the projections? For a household to be classified as “ready for retirement” under the CRR method, a projected replacement rate is simply compared with a benchmark rate, while the RSPM uses a fully developed stochastic decumulation process to determine whether a family will run short of money in retirement (and, if so, at what age) under each of a thousand alternative, simulated retirement paths. Unlike the CRR model, EBRI’s RSPM model simultaneously considers the impact of longevity risk, investment risk, and the risk of potentially catastrophic health care costs (such as prolonged stays in a nursing home).5

Which, as it so happens, are the same things that those trying to make sure they have enough money to last through retirement—and those trying to help them do so—need to consider.

Nevin E. Adams, JD

1 see “Is Working to Age 70 Really the Answer for Retirement Income Adequacy?

2 Also from the above article, “It’s worth nothing that a significant portion of the improvement in readiness takes place in the first four years after age 65, but that tends to level off in the early 70s before picking up in the late 70s and early 80s. Higher-income households would be in a much better situation: 90 percent of the highest-income quartile would already have a 50 percent probability of success by age 65, while those in the next-highest income quartile would need to wait until age 72 for 90 percent of their group to have a 50 percent probability. Those in the second-lowest income quartile would need to wait until age 81 before 90 percent of their group had a 50 percent probability of success.

3 At the same time, the percentage of workers expecting to retire before age 65 has decreased from 50 percent in 1991 to 24 percent (see this EBRI analysis, online here). A sizable proportion of retirees report each year that they retired sooner than they had planned (50 percent in 2012). Those who retire early often do so for negative reasons, such as a health problem or disability (51 percent) or company downsizing or closure (21 percent). The 2011 RCS found that the poor economy (36 percent), lack of faith in Social Security or the government (16 percent) and a change in employment situation (15 percent) were the most frequently cited reasons for postponing retirement.

4. For more on how this modeling works, see “Single Best Answer.”

5 For an explanation of four things that are sometimes overlooked by retirement-needs projection models, see “Generation ‘Gaps,’” online here.

Sunday, September 09, 2012

APP Solution

A couple of weeks back, I was on one of Virginia’s Civil War battlefields, looking to join one of the local park ranger tours. This particular one was scheduled to start deep within the park itself, and while I left home certain that I knew where I was heading, when I got there, I quickly discovered otherwise.

Fortunately, or so I thought at the time, there were about a half dozen other individuals also looking to find the same tour. We quickly convened around a shared map, looked for landmarks, and—based on the collective sense of the group—headed off in what seemed to be the right direction.

Five minutes later I began to suspect we were not heading in the right direction, and 15minutes later I was sure of it. Then I remembered that I had recently downloaded a smartphone “app” for this particular battlefield—one that not only contained a map, but also a GPS feature that allowed me to not only find where I was but to visualize where I needed to be. With that, we could begin heading in the right direction.

Smartphones are an increasingly important part of our lives, in no small part because of the “apps” (short for applications) that they bring to us. These days, apps make it possible to order a pizza, identify that song playing on the radio (and order and/or download your own copy), scan price codes and comparison shop without leaving the store.

While many of today’s “apps” offer much in the way of entertainment and informational value, a great many of them also make it easy to spend , rather than save, money. In fact, the 2012 Retirement Confidence Survey by the Employee Benefit Research Institute and Mathew Greenwald & Associates, Inc., found that the use of technology, such as smart phones and tablet computers to help manage finances was still relatively rare.¹

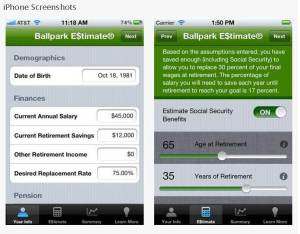
But now there’s a new app designed to make it easier to know where you are in your retirement savings: the EBRI Ballpark E$timate,® developed by Matrix Group International, Inc., and the research team at EBRI, and provided by Choose to Save.®

As a web-based tool, and as a hardcopy reference, the EBRI Ballpark E$timate® (as well as other tools and information available at www.choosetosave.org²) has long helped millions of Americans do a better job of planning for their financial future.

Now the EBRI Ballpark E$timate® “app” (like that smartphone GPS) can help Americans do a better job of knowing where they are—so they can make sure they are headed in the right direction, too.

The EBRI Ballpark E$timate® is currently available as a free download from the iPhone store. More information is online here.

Nevin E. Adams, JD

¹ “The 2012 Retirement Confidence Survey: Job Insecurity, Debt Weigh on Retirement Confidence, Savings,” is online here.

² In addition to the Ballpark E$timate,® you will find a wide variety of free tools and innovative resources, including free videos that can be used to share key savings messages with participants available at www.choosetosave.org

Sunday, September 02, 2012

“Storm” Warnings

Amidst the recent coverage of Hurricane Isaac, I was reminded that it was only a year ago that Hurricane Irene came barreling up the East Coast. We had just deposited my youngest off for his first semester of college, and then spent the drive home up the East Coast with Irene (and the reports of her potential destruction and probable landfalls) close behind. We arrived home, unloaded in record time, and went straight to the local hardware store to stock up for the coming storm.

We weren’t the only ones to do so, of course. And what we had most hoped to acquire (a generator) was not to be found—there, or at that moment, apparently anywhere in the state.

What made that situation all the more infuriating was that, while the prospect of a hurricane landfall was relatively unique, we had, on several prior occasions, been without power, and for extended periods. After each I had told myself that we really needed to invest in a generator—but, as human beings are inclined to do, thinking that I had time to do so when it was more convenient, I simply (and repeatedly) postponed taking action.

Life is full of uncertainty, and events and circumstances, as often as not, happen with little, if any warning. However, hurricanes you can see coming a long way off. There’s always the chance that they will peter out sooner than expected, that landfall will result in a dramatic shift in course and/or intensity, or that, as with Hurricane Katrina, the real impact is what happens afterward. In theory, at least, that provides time to prepare—but, as I was reminded a year ago, sometimes you don’t have time enough.

I suppose a lot of retirement plan participants are going to look back at their working lives that way as they near the threshold of retirement. They’ll likely remember the admonitions about saving sooner, saving more, and the importance of regular, prudent reallocations of investment portfolios.

The Retirement Confidence Survey (RCS) has, for years now, chronicled not only the current state of retirement unpreparedness of many, but their awareness of the need to be more attentive to those preparations. Sure, you can find yourself forced suddenly into an unplanned retirement—in fact, retiree respondents to the RCS have long indicated that they stopped working sooner than they had planned.¹ But most of us have plenty of time, both to see that day coming, and to do something about it.

Ultimately, of course, what matters isn’t the time you have, it’s what you do² with it.

Nevin E. Adams, JD

¹ Twenty-five percent of workers in the 2012 Retirement Confidence Survey say the age at which they expect to retire has changed in the past year. In 1991, 11 percent of workers said they expected to retire after age 65, and by 2012 that more than tripled, to 37 percent. Those expectations notwithstanding, half of current retirees surveyed say they left the work force unexpectedly due to health problems, disability, or changes at their employer, such as downsizing or closure (see “The 2012 Retirement Confidence Survey: Job Insecurity, Debt Weigh on Retirement Confidence, Savings,” online here).

² A great place to start those preparations is to figure out what you’ll need, as millions of Americans have with the BallparkE$timate,® developed by the research team at the Employee Benefit Research Institute, and available online here.

Additionally, a wide variety of free tools and innovative resources, including free videos that can be used to share key savings messages with participants, is available here.